Cloud Monitoring
Dashboard
ThingSpeak cloud platform with MATLAB analytics for real-time data visualization, trend analysis, and automated risk detection.
ThingSpeak IoT Platform
ThingSpeak is an open IoT analytics platform developed by MathWorks (the makers of MATLAB). It is designed specifically for collecting, storing, analyzing, and visualizing data from IoT devices — making it ideal for the slope monitoring application.
The ESP32 microcontroller transmits sensor readings to ThingSpeak via HTTP POST requests using the ThingSpeak REST API. Each data point is tagged with a timestamp and stored in the cloud database. ThingSpeak's built-in charting tools automatically create time-series plots for each data channel.
Crucially, ThingSpeak integrates directly with MATLAB Online, allowing complex analysis scripts to be run automatically on incoming data — enabling the Slope Stability Index calculation and automated risk classification.
📊 View Live ThingSpeak Dashboard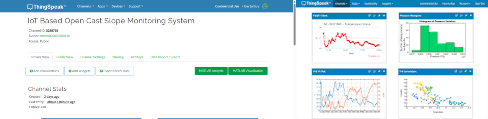
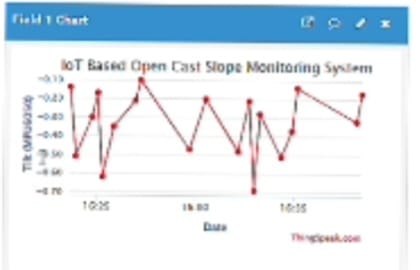
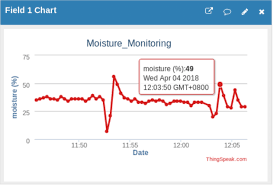
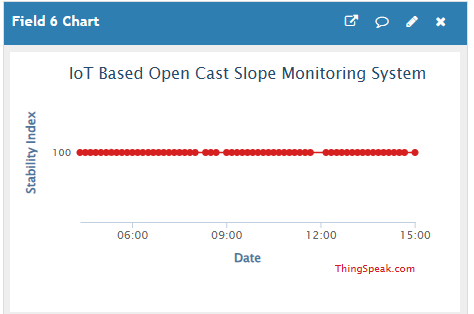
ThingSpeak Data Fields
The monitoring channel is configured with six data fields, each storing a different parameter from the ESP32 sensor system.
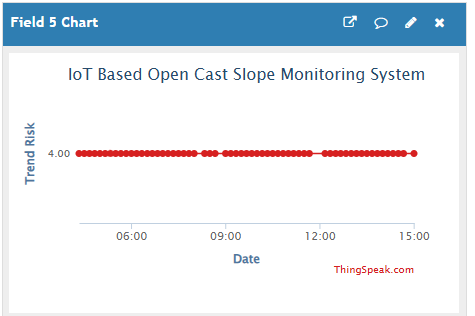
MATLAB Trend Analysis
MATLAB Analysis scripts run automatically on the ThingSpeak platform whenever new data arrives. The scripts perform trend analysis on historical sensor data to detect gradual slope deterioration that may not trigger immediate real-time alerts.
SSI Formula
• TiltScore: 5 (low) → 15 (moderate) → 25 (high) → 40 (critical)
• MoistureScore: 5 (dry) → 10 (moist) → 20 (wet) → 35 (saturated)
• VibrationScore: 0 (none) → 15 (detected)
Trend Analysis Functions
- Moving average smoothing of SSI over rolling time windows
- Rate-of-change detection (slope of SSI trend)
- Threshold crossing alert generation
- Statistical anomaly detection for sudden changes
Risk Classification Zones